SyGage — Understand Usage, Build Engagement

You've rolled out the software — but is your team really using it? SyGage turns usage data into a clear view of adoption, engagement, and where people need more support, so your software investment actually delivers.

See Who's Really Using Your Software

Login counts don't tell you much. SyGage looks at how people actually work in your business applications — which features they use, where they get stuck, and how that changes over time — and turns it into a clear adoption and engagement picture.

✓Usage visibility
✓Feature adoption
✓Engagement trends
✓Team comparisons
✓Adoption gaps
✓Progress over time
See What SyGage Surfaces
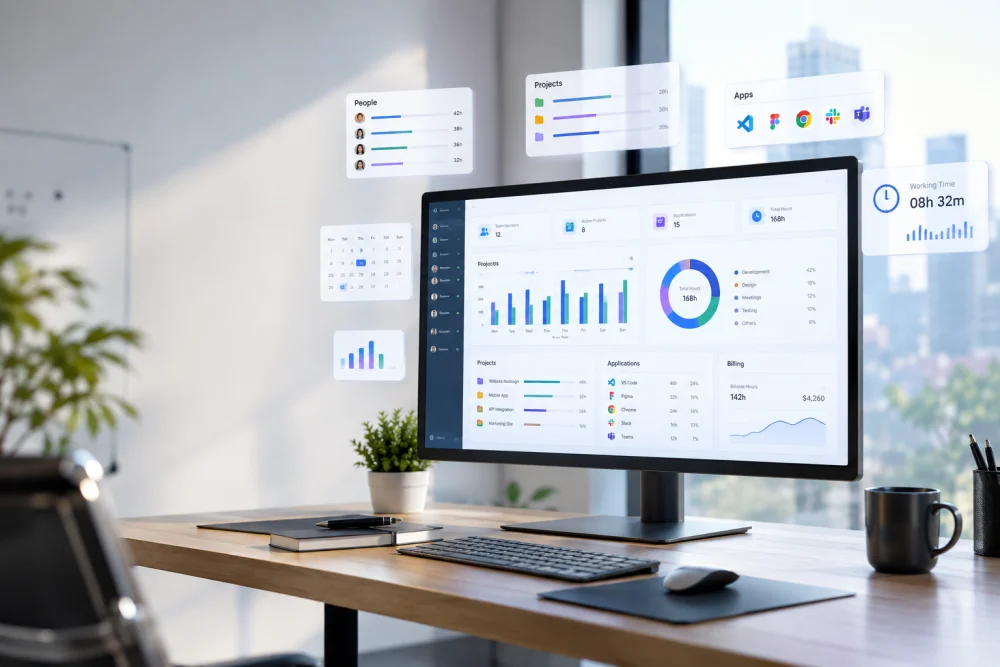
SyGage software adoption and usage analytics
Usage Analytics

Login Counts Don't Tell the Whole Story

There's a big difference between software being deployed and software being adopted.

Without SyGage
  • Software is live, but whether it's truly used is anyone's guess
  • Login counts hide who's actually working in the system
  • Training is rolled out with no proof it changed anything
  • Struggling teams and low adoption are noticed far too late
With SyGage
  • See real, meaningful usage — feature by feature, app by app
  • Know exactly who's engaged, who's stuck, and who's dropped off
  • Prove that training actually changed the way people work
  • Spot at-risk rollouts early and step in before they stall

Proposed Capabilities

What SyGage is designed to surface from your usage data — subject to the integrations available in your environment.

Usage and feature adoption

Usage & Feature Adoption

See who's really using each application, and which features land.

  • Usage visibility
  • Feature adoption
  • Active vs idle users
  • Most-used features
  • Least-used features
  • Usage by application
Engagement and trends

Engagement & Trends

Track how engagement moves over time, not just today's logins.

  • Engagement trends
  • Progress monitoring
  • Weekly & monthly movement
  • Before vs after training
  • Rising & declining usage
  • Long-term adoption
Teams and adoption gaps

Teams & Gaps

Compare adoption across the business and see exactly where to help.

  • Team comparisons
  • Adoption gaps
  • By department & role
  • By location & branch
  • Where usage is low
  • Where to focus support
Dashboards and alerts

Dashboards & Alerts

Clear views and alerts that keep owners, IT, and training teams informed.

  • Dashboards & alerts
  • Training insights
  • Owner & IT views
  • Adoption alerts
  • Shareable reports
  • At-a-glance summaries

How SyGage Works

A simple loop that turns raw usage into better adoption — and keeps improving it.

1. Collect Usage Data

Bring together usage signals from across your business applications.

2. Identify Adoption Gaps

See where usage is low, features are missed, or certain teams lag behind.

3. Target Support

Focus training and support exactly where the data says it's needed.

4. Review Change Over Time

Measure whether adoption and engagement actually improved — then repeat.

Turn Software Spend Into Real Adoption

Rolling out software is the easy part — getting people to truly use it is where the value is won or lost. SyGage is designed to make adoption visible, so owners, IT, and transformation leaders can see what's working and act on what isn't.

Instead of guessing from login counts, you get a clear, ongoing view of engagement — by team, by feature, and over time — and evidence of whether your training and support are paying off.

Move beyond login counts to real usage
See adoption by team and by feature
Get evidence that training actually works
Spot at-risk rollouts early and act

See SyGage in Action

Tell us about the software your teams use, and we'll show you how SyGage can turn that usage into a clear view of adoption, engagement, and where to focus next.

Frequently Asked Questions

What is SyGage?

SyGage is a software adoption and usage analytics product from Symake. It's designed to help organisations understand whether employees are actually using their business software — turning usage information into a clear view of engagement, adoption gaps, and areas that need support.

Who is SyGage for?

SyGage is built for business application owners, IT teams, transformation leaders, department managers, and implementation teams — anyone responsible for making a software rollout actually succeed.

How is SyGage different from just counting logins?

Logins only tell you someone opened the software. SyGage focuses on meaningful usage — which features are used, by which teams, and how that changes over time — so you can see real adoption and engagement rather than surface-level activity.

What software can SyGage analyse?

SyGage is designed to work alongside your existing business applications. The exact capabilities depend on the integrations available in your environment — so the best first step is to tell us about your software stack, and we'll map out what SyGage can surface for you.

Can it compare adoption across teams?

Yes — team comparisons are a core part of the vision. SyGage is designed to compare adoption across teams, departments, and locations, so you can see who's thriving and who needs more support.

Does it show whether training worked?

That's one of the main goals. By tracking usage before and after training and support, SyGage is designed to give you evidence of whether behaviour actually changed — instead of assuming training landed.

Is SyGage built on Odoo?

SyGage is delivered by Symake and is designed as an analytics layer over your existing business software, rather than a single Odoo module. It complements the platforms your teams already use — including Odoo — by measuring how well they're adopted.

Is SyGage available now?

SyGage is an evolving product, and its capabilities are shaped by the integrations available for your systems. If software adoption is a priority for your organisation, get in touch and we'll walk you through what's possible today and what's on the roadmap.

Call us WhatsApp